Data-Driven Infographics
When you want to share information with someone, you tell, orally or in writing.
However, if you want the person to remember this information, communicate a visual story with an infographic.
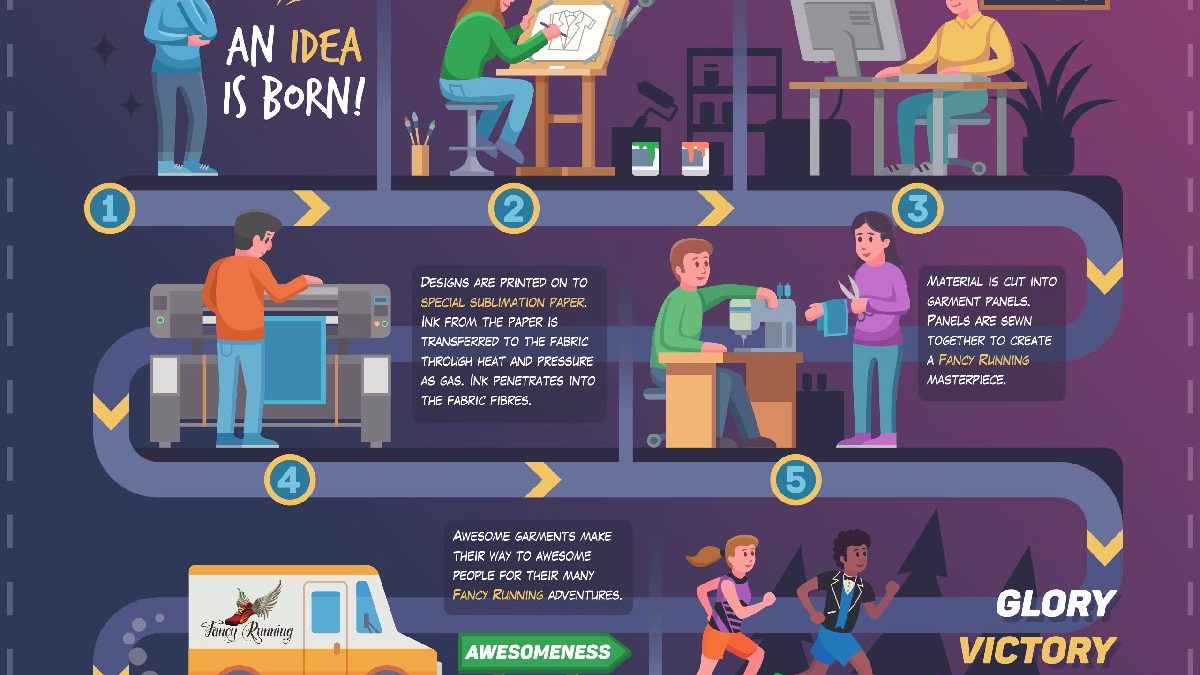
Infographics are an appealingly attractive way to condense data and share information with content consumers more interactively and persuasively.
They can tell a story that will enthrall the reader in a way that words alone cannot.
Additionally, if you want to expand your brand, it is critical that you follow the direction of the demand, and collect and analyze data to ensure success. To accumulate this data, and then analyze it for data visualization, you will need a good internet connection. For this, consider using a popular and widely used ISP such as Cox. It offers a variety of internet plans and packages that will surely fit your needs. However, the best aspect of this ISP is the Cox Atencion al cliente that is available around the clock, so you will not have to wait for any issues to be resolved. A fast connection can also put you ahead of your competition.
Table of Contents
What is Data Visualization?
Data visualization is the presentation of statistical data in a graphical form that is easy to interpret by the viewer. For data to stand out and engage the viewer, it must be aesthetically pleasing, but not so distracting that the images lose their meaning. Data visualization is carried out in the form of charts, graphs, and diagrams.
What are Infographics?
Infographics are closely linked to data visualization, conveying information through a visual illustration of a story. These images creatively complement the information. Infographics deduce data through visual storytelling. Infographics can be found all over the internet. They are incorporated in presentations, annual reports, blog content, etc.
A simple yet smart infographic conveys a lot of information with just a few shapes and colors. It is designed well, expresses a good story, and is comprehendible.
Sources of information are highlighted for the reader, which makes them more reliable. Numbers that you should pay attention to are in bold to grab the reader’s attention. Here are some benefits of using infographics:
1. Increased Engagement
We are visual creatures and therefore drawn to the appeal that infographics exude. The reason visual content sells is that it induces emotions that readers love. This is what makes infographics a powerful marketing tool, they are very visual.
2. Better Decision Making
Visual effects accelerate the speed of information processing. The faster you process information, the quicker the decisions making will be.
This can be an advantage when complex ideas need to be presented, for example breaking down scientific research into comprehensive material. The mind processes information in images much faster than in words, and humans are visual creatures by nature. When you are trying to understand something complex, infographics help your brain process it faster.
This, in turn, helps your business communicate its end goal faster and more efficiently.
3. Avoid information Overload
What makes infographics so compelling is that they make nonfigurative and multifaceted questions simple and tangible and demonstrate configurations in big data.
Processing a large amount of information often leads to overload, which many of us try to avoid. Information overload is usually caused by insignificance and redundancy, as well as the presence of various resources competing for attention.
The sheer volume of information that bombards us daily can make us feel like we are suffocating. This can lead to corporeal overload and symptoms such as agitation, petulance, and stress that affect efficiency, performance, and health.
4. Builds brand Credibility
Developing exciting and educational images can help people learn more about you or your business and can help you become an authority figure. Positioning yourself as proficient in your industry will not only make you a thought leader but also build trust in your brand.
By becoming a trusted source by creating original infographics with helpful resources and related images, sales are bound to increase as well.
5. Improves Learning
What makes infographics a great learning tool is the fact that they contain visual cues. Visual aids are also fundamental to building knowledge. Metacognition relates to the use of visual tools to explain cognitive processes that help establish knowledge.
When we gather data, question, and apply previously acquired knowledge, we use mind maps to transform data into knowledge. This helps show how important visual content is for education. We use visual aids to integrate new information into prevailing knowledge that we can later associate with new circumstances. In the classroom, teaching aids that combine text and images help simplify content and keep students engaged. Such tools can also be used by brands to make content easy to understand whether it is an annual report or a product demonstration, so audiences can understand quicker and recall information longer.
6. Ease of result Tracking
As is the case with any marketing approach, you need to contribute resources and time to keep track of how well your infographic is performing. While the performance of some of your marketing initiatives is mixed and ROI is hard to measure, this is not the case with infographics.
In an ideal world, every infographic you create would present many important ideas clearly and concisely. However, some may be more effective than others. With the right tracking, it can be relatively easy to determine how effective your infographic marketing efforts are to expand and scale them in the future.
Conclusion
For most people, infographics are the best way to present their data in an easy-to-understand and attractive way. Infographics are also a great way for companies to convince their target market of a specific call to action that can be applied to everything from marketing, sales, and training to HR and management. It is a versatile way to tell a story and present credible data to the targeted customer segment.


Review How Data-Driven Infographics are Important for your Business?.